


Contura Announces Fourth Quarter 2019 Results
• Net Loss from continuing operations of $192 million for the fourth quarter 2019 included a pre-tax non-cash asset impairment charge of $60 million and a goodwill impairment of $124 million
• Adjusted EBITDA(1) of $31 million for the fourth quarter 2019(2)
• Reducing 2020 capital expenditures guidance by $30 million, maintaining other guidance
BRISTOL, Tenn., March 18, 2020 – Contura Energy, Inc. (NYSE: CTRA), a leading U.S. coal supplier, today reported results for the fourth quarter ending December 31, 2019.
(millions, except per share)
Three months ended Dec. 31, 2019(2) Three months ended Sept. 30, 2019(2) Three months ended Dec. 31, 2018(2)
Net (loss) income(3) $(191.9) $(43.6) $155.9
Net (loss) income(3) per diluted share $(10.54) $(2.29) $9.85
Adjusted EBITDA(1) $31.5 $40.0 $111.2
Operating cash flow(4) $(5.7) $20.4 $(17.9)
Capital expenditures $48.2 $60.3 $25.2
Tons of coal sold 5.7 5.8 5.5
1. These are non-GAAP financial measures. A reconciliation of Net Income to Adjusted EBITDA is included in tables accompanying the financial schedules.
2. Excludes discontinued operations.
3. From continuing operations.
4. Includes discontinued operations.
“As we recently announced, Contura made significant progress in achieving operational efficiencies and overhead cost containment improvements in the fourth quarter, and we remain steadfastly committed to progress on these goals,” said chairman and chief executive officer, David Stetson. “In the early months of 2020 we have continued to build on the momentum, executing our strategy through a more nimble operating culture that is yielding additional operational productivity advances.”
“In addition to achieving nearly a 10% increase in feet per shift at our CAPP underground mines in the fourth quarter, we are pleased to announce that the Road Fork 52 mine started production as scheduled on February 26,” said Jason Whitehead, Contura’s chief operating officer. “This low vol met mine, which we expect to largely serve as replacement tons for existing operations that are mining out, has annual production capacity up to 1.3 million tons a year with expected cost of coal sales of approximately $70 per ton.”
Financial Performance
Contura reported a net loss from continuing operations of $191.9 million, or $10.54 per diluted share, for the fourth quarter 2019. The fourth quarter loss includes a pre-tax non-cash asset impairment charge of $60.5 million and a goodwill impairment of $124.4 million. In the third quarter 2019, the company had a net loss from continuing operations of $43.6 million or $2.29 per diluted share.
Total Adjusted EBITDA was $31.5 million for the fourth quarter, compared with $40.0 million in the third quarter.
Coal Revenues
(millions) Three months ended Dec. 31, 2019 Three months ended Sept. 30, 2019
CAPP - Met $370.2 $373.1
CAPP - Thermal $60.6 $80.2
NAPP $65.8 $70.7
CAPP - Met (excl. f&h)(1) $310.9 $323.0
CAPP - Thermal (excl. f&h)(1) $50.1 $70.3
NAPP - (excl. f&h)(1) $62.4 $67.8
(millions) Three months ended Dec. 31, 2019 Three months ended Sept. 30, 2019
CAPP - Met 3.3 3.0
CAPP - Thermal 0.9 1.1
NAPP 1.5 1.6
1. Represents Non-GAAP coal revenues which is defined and reconciled under “Non-GAAP Financial Measures” and “Results of Operations.”
The CAPP – Met revenue decline in the fourth quarter was driven by a 12 percent decline in price realizations relative to the third quarter, partially offset by increased volumes, while CAPP – Thermal revenues declined as a result of lower prices and fewer tons sold. In the NAPP segment, the revenues were reduced due to slightly lower shipments in the fourth quarter versus the third quarter.
Coal Sales Realization(1)
(per ton) Three months ended Dec. 31, 2019 Three months ended Sept. 30, 2019
CAPP - Met $94.98 $108.35
CAPP - Thermal $56.13 $61.46
NAPP $41.17 $41.33
1. Represents Non-GAAP coal sales realization which is defined and reconciled under “Non-GAAP Financial Measures” and “Results of Operations.”
As a result of further weakening in the metallurgical coal market in the fourth quarter, our average CAPP – Met coal sales realization for the fourth quarter 2019 declined 12 percent to $94.98 per ton over the prior quarter. Thermal markets also saw softer prices in the fourth quarter as our CAPP – Thermal coal average price was down 9 percent from the third quarter, while the average NAPP realization was essentially flat with the prior quarter.
Cost of Coal Sales
(in millions, except per ton data) Three months ended Dec. 31, 2019 Three months ended Sept. 30, 2019
Cost of Coal Sales $444.6 $467.7
Cost of Coal Sales (excl. f&h/idle)(1) $366.4 $400.0
(per ton) Three months ended Dec. 31, 2019 Three months ended Sept. 30, 2019
CAPP - Met(1) $82.26 $87.32
CAPP - Thermal(1) $49.21 $59.17
NAPP(1) $34.67 $43.87
1. Represents Non-GAAP cost of coal sales per ton which is defined and reconciled under “Non-GAAP Financial Measures” and “Results of Operations.”
All the segments saw improvements in cost of coal sales compared to third quarter, with costs in CAPP – Met for the quarter averaging more than $5.00 lower than in the third quarter. The primary driver was higher productivity as measured by clean tons per foot and feet per shift. Our productivity continued to show similar improvements in the early part of the first quarter 2020. Overall, our deep mines in the CAPP region realized a 9 percent increase in feet per shift in the fourth quarter over the prior quarter.
The fourth quarter NAPP cost of coal sales also saw meaningful reduction as a longwall move and employee vacations had resulted in an elevated third quarter 2019 cost per ton. CAPP – Thermal cost of coal sales were significantly lower in the fourth quarter as the thermal deep mines feet per shift increased by 12 percent over the third quarter. In addition, the third quarter CAPP – Thermal cost was negatively impacted by approximately a $3.00 per ton environmental settlement.
Selling, general and administrative (SG&A) and depreciation, depletion and amortization (DD&A) expenses
(millions) Three months ended Dec. 31, 2019 Three months ended Sept. 30, 2019
SG&A $25.8 $17.4
Less: non-cash stock compensation and one-time expenses $(12.7) $(2.2)
Non-GAAP SG&A(1) $13.1 $15.2
DD&A $43.9 $60.8
1. Represents Non-GAAP SG&A which is defined under “Non-GAAP Financial Measures.”
As a result of our management restructuring in the fourth quarter 2019, SG&A expenses, excluding non-cash stock compensation expense of $4.7 million and one-time expenses of $8.0 million, primarily associated with management restructuring, declined by more than $2 million from the third quarter to $13.1 million.
Liquidity and Capital Resources
“Despite the difficult market conditions in the fourth quarter, Contura’s cash balance increased by more than $60 million over that period, ending the year with more than $325 million in liquidity,” said Andy Eidson, Contura’s chief financial officer. “In these early months of 2020, we continue to be keenly focused on cost savings and cash optimization amid widespread uncertainty related to the coronavirus and its potential impact on global economies and specifically met markets.”
Cash used in operating activities for the fourth quarter 2019, including discontinued operations, was $5.7 million, and capital expenditures for the fourth quarter were $48.2 million. In the prior period, the cash provided by operating activities was $20.4 million and capital expenditures were $60.3 million.
At the end of December 2019, Contura had $212.8 million in unrestricted cash and $165.7 million in restricted cash, deposits and investments. Unrestricted cash increased $60.2 million in the fourth quarter, which included a tax refund of $65.3 million. Total long-term debt, including the current portion of long-term debt as of December 31, 2019, was approximately $593.0 million. At the end of the fourth quarter, the company had total liquidity of $327.8 million, including cash and cash equivalents of $212.8 million and $115.0 million of unused commitments available under the Asset-Based Revolving Credit Facility. As of December 31, 2019, the company had no borrowings and $99.8 million in letters of credit outstanding under the Asset-Based Revolving Credit Facility.
2020 Full-Year Guidance
The company is maintaining its total 2020 coal shipments guidance range of 20.7 million tons to 22.7 million tons, with CAPP – Met volume remaining at 12.0 million to 12.6 million tons and CAPP – Thermal volume remaining at 2.7 million tons to 3.3 million tons. NAPP volumes also remain at the previous range of 6.0 million tons to 6.8 million tons.
For 2020, Contura has committed and priced approximately 52% of CAPP – Met at an average expected price of $97.91 per ton, while we are 100% committed and priced at an average price of $55.95 per ton for CAPP – Thermal and 100% committed and priced for NAPP at an average price of $43.43 per ton.
The company also expects 2020 costs to remain unchanged with CAPP – Met cost of coal sales per ton at a range of $76.00 to $81.00. CAPP – Thermal is expected to be in the range of $56.00 to $60.00 per ton and NAPP in the range of $34.00 to $38.00 per ton.
For 2020, the company expects its SG&A to be in the range of $50 million to $55 million, excluding non-recurring items and stock compensation. We are reducing our 2020 capital expenditures guidance by $30 million to a range of $145 million to $165 million; maintaining depreciation, depletion and amortization between $230 million and $260 million; and cash interest expense in the range of $48 million and $52 million.
2020 Guidance
in millions of tons Low High
CAPP - Metallurgical 12.0 12.6
CAPP - Thermal 2.7 3.3
NAPP 6.0 6.8
Total Shipments 20.7 22.7
Committed/Priced1,2,3 Committed Average Price
CAPP - Metallurgical 52% $97.91
CAPP - Thermal 100% $55.95
NAPP 100% $43.43
Committed/Unpriced1,3 Committed
CAPP - Metallurgical 27%
CAPP - Thermal 0%
NAPP 0%
Costs per ton4 Low High
CAPP - Metallurgical $76 $81
CAPP - Thermal $56 $60
NAPP $34 $38
In millions (except taxes) Low High
SG&A5 $50 $55
Idle Operations Expense $16 $20
Cash Interest Expense $48 $52
DD&A $230 $260
Capital Expenditures $145 $165
Tax Rate --% 5%
Notes:
1. Based on committed and priced coal shipments as of March 6, 2020. Committed percentage based on the midpoint of shipment guidance range.
2. Actual average per-ton realizations on committed and priced tons recognized in future periods may vary based on actual freight expense in future periods relative to assumed freight expense embedded in projected average per-ton realizations.
3. Includes estimates of future coal shipments based upon contract terms and anticipated delivery schedules. Actual coal shipments may vary from these estimates.
4. Note: The Company is unable to present a quantitative reconciliation of its forward-looking non-GAAP cost of coal sales per ton sold financial measures to the most directly comparable GAAP measures without unreasonable efforts due to the inherent difficulty in forecasting and quantifying with reasonable accuracy significant items required for the reconciliation. The most directly comparable GAAP measure, GAAP cost of sales, is not accessible without unreasonable efforts on a forward- looking basis. The reconciling items include freight and handling costs, which are a component of GAAP cost of sales. Management is unable to predict without unreasonable efforts freight and handling costs due to uncertainty as to the end market and FOB point for uncommitted sales volumes and the final shipping point for export shipments. These amounts have historically varied and may continue to vary significantly from quarter to quarter and material changes to these items could have a significant effect on our future GAAP results.
5. Excludes expenses related to non-cash stock compensation and non-recurring business development expenses.
Conference Call
The company plans to hold a conference call regarding its fourth quarter 2019 results on March 18, 2020, at 10:00 a.m. EDT. The conference call will be available live on the investor section of the company’s website at http://investors.conturaenergy.com/investors. Analysts who would like to participate in the conference call should dial 877-791-0213 (domestic toll-free) or 647-689-5651 (international) approximately 10 minutes prior to the start of the call.
ABOUT CONTURA ENERGY
Contura Energy (NYSE: CTRA) is a Tennessee-based coal supplier with affiliate mining operations across major coal basins in Pennsylvania, Virginia and West Virginia. With customers across the globe, high-quality reserves and significant port capacity, Contura Energy reliably supplies both metallurgical coal to produce steel and thermal coal to generate power. For more information, visit www.conturaenergy.com.
FORWARD-LOOKING STATEMENTS
This news release includes forward-looking statements. These forward-looking statements are based on Contura’s expectations and beliefs concerning future events and involve risks and uncertainties that may cause actual results to differ materially from current expectations. These factors are difficult to predict accurately and may be beyond Contura’s control. Forward-looking statements in this news release or elsewhere speak only as of the date made. New uncertainties and risks arise from time to time, and it is impossible for Contura to predict these events or how they may affect Contura. Except as required by law, Contura has no duty to, and does not intend to, update or revise the forward-looking statements in this news release or elsewhere after the date this release is issued. In light of these risks and uncertainties, investors should keep in mind that results, events or developments discussed in any forward-looking statement made in this news release may not occur.
FINANCIAL TABLES FOLLOW
Non-GAAP Financial Measures
The discussion below contains “non-GAAP financial measures.” These are financial measures which either exclude or include amounts that are not excluded or included in the most directly comparable measures calculated and presented in accordance with generally accepted accounting principles in the United States (“U.S. GAAP” or “GAAP”). Specifically, we make use of the non-GAAP financial measure “Adjusted EBITDA,” “non-GAAP coal revenues,” “non-GAAP cost of coal sales,” and “Adjusted cost of produced coal sold.” We use Adjusted EBITDA to measure the operating performance of our segments and allocate resources to the segments. Adjusted EBITDA does not purport to be an alternative to net income (loss) as a measure of operating performance. We use non-GAAP coal revenues to present coal revenues generated, excluding freight and handling fulfillment revenues. Non-GAAP coal sales realization per ton for our operations is calculated as non-GAAP coal revenues divided by tons sold. We use non-GAAP cost of coal sales to adjust cost of coal sales to remove freight and handling costs, idled and closed mine costs and coal inventory acquisition accounting impacts. Non-GAAP cost of coal sales per ton for our operations is calculated as non-GAAP cost of coal sales divided by tons sold. Non-GAAP coal margin per ton for our coal operations is calculated as non-GAAP coal sales realization per ton for our coal operations less non-GAAP cost of coal sales per ton for our coal operations. We also use Adjusted cost of produced coal sold to distinguish the cost of captive produced coal from the effects of purchased coal. The presentation of these measures should not be considered in isolation, or as a substitute for analysis of our results as reported under GAAP.
Management uses non-GAAP financial measures to supplement GAAP results to provide a more complete understanding of the factors and trends affecting the business than GAAP results alone. The definition of these non-GAAP measures may be changed periodically by management to adjust for significant items important to an understanding of operating trends and to adjust for items that may not reflect the trend of future results by excluding transactions that are not indicative of our core operating performance. Furthermore, analogous measures are used by industry analysts to evaluate the Company’s operating performance. Because not all companies use identical calculations, the presentations of these measures may not be comparable to other similarly titled measures of other companies and can differ significantly from company to company depending on long-term strategic decisions regarding capital structure, the tax jurisdictions in which companies operate, and capital investments.
Included below are reconciliations of non-GAAP financial measures to GAAP financial measures.
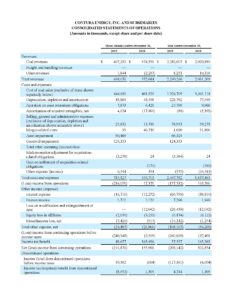
CONTURA ENERGY, INC. AND SUBSIDIARIES CONSOLIDATED STATEMENTS OF OPERATIONS
(Amounts in thousands, except share and per share data)
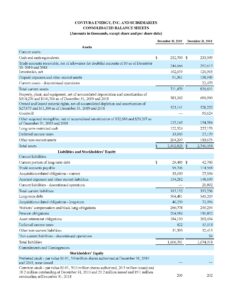
CONTURA ENERGY, INC. AND SUBSIDIARIES CONSOLIDATED BALANCE SHEETS
(Amounts in thousands, except share and per share data)
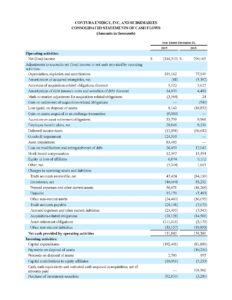
CONTURA ENERGY, INC. AND SUBSIDIARIES CONSOLIDATED STATEMENTS OF CASH FLOWS
(Amounts in thousands)
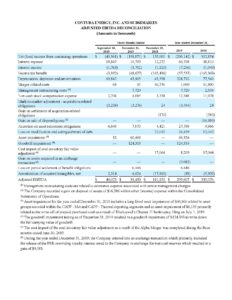
CONTURA ENERGY, INC. AND SUBSIDIARIES ADJUSTED EBITDA RECONCILIATION
(Amounts in thousands)
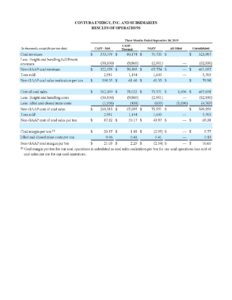
CONTURA ENERGY, INC. AND SUBSIDIARIES RESULTS OF OPERATIONS
(Amounts in thousands, except for per ton data)
Media Contact
Investor Contact
InvestorRelations@
External Resources
Metallurgical Coal Producers Association (MCPA)
![]()
National Mining Association (NMA) Industry News and Resources
![]()