


Alpha Announces Third Quarter 2025 Financial Results
• Reports third quarter net loss of $5.5 million
• Records Adjusted EBITDA of $41.7 million for the quarter
• Posts total liquidity of $568.5 million as of September 30
• Achieves back-to-back record quarterly cost of coal sales performance since 2021
• Reduces 2025 guidance range for capital contributions to equity affiliates
BRISTOL, Tenn., November 6, 2025 – Alpha Metallurgical Resources, Inc. (NYSE: AMR), a leading U.S. supplier of metallurgical products for the steel industry, today reported financial results for the third quarter ending September 30, 2025.
(millions, except per share)
| Three months ended Sep. 30, 2025 | Three months ended June 30, 2025 | Three months ended Sep. 30, 2024 | |
|---|---|---|---|
| Net (loss) income | ($5.5) | ($5.0) | $3.8 |
| Net (loss) income per diluted share | ($0.42) | ($0.38) | $0.29 |
| Adjusted EBITDA(1) | $41.7 | $46.1 | $49.0 |
| Operating cash flow | $50.6 | $53.2 | $189.5 |
| Capital expenditures | ($25.1) | ($34.6) | ($31.5) |
| Tons of coal sold | 3.9 | 3.9 | 4.1 |
__________________________________
1. These are non-GAAP financial measures. A reconciliation of Net Income to Adjusted EBITDA is included in tables accompanying the financial schedules.
“In back-to-back quarters, the highlight of our quarterly results is our cost performance,” said Andy Eidson, Alpha’s chief executive officer. “Reducing costs by almost three dollars as compared to last quarter’s excellent results is an achievement to be proud of. I appreciate the team’s hard work in achieving this milestone, especially given the difficult market backdrop we continue to experience.”
Eidson continued: “Looking ahead, we remain focused on domestic negotiations for 2026 tons and building out our budget for the coming year. Once we gain clarity on these important details, we will provide more information about our expectations and guidance for 2026.”
Financial Performance
Alpha reported a net loss of $5.5 million, or $0.42 per diluted share, for the third quarter 2025, as compared to net loss of $5.0 million, or $0.38 per diluted share, in the second quarter.
Total Adjusted EBITDA was $41.7 million for the third quarter, compared to $46.1 million in the second quarter.
Coal Revenues
| (millions) | Three months ended Sep. 30, 2025 | Three months ended June 30, 2025 |
|---|---|---|
| Met Segment | $525.2 | $548.7 |
| Met Segment (excl. freight & handling)(1) | $442.8 | $464.1 |
Tons Sold
| (millions) | Three months ended Sep. 30, 2025 | Three months ended June 30, 2025 |
|---|---|---|
| Met Segment | 3.9 | 3.9 |
__________________________________
1. Represents Non-GAAP coal revenues which is defined and reconciled under “Non-GAAP Financial Measures” and “Results of Operations.”
Coal Sales Realization(1)
| (per ton) | Three months ended Sep. 30, 2025 | Three months ended June 30, 2025 |
|---|---|---|
| Met Segment | $114.94 | $119.43 |
__________________________________
1. Represents Non-GAAP coal sales realization which is defined and reconciled under “Non-GAAP Financial Measures” and “Results of Operations.”
Third quarter net realized pricing for the Met segment was $114.94 per ton.
The table below provides a breakdown of our Met segment coal sold in the third quarter by pricing mechanism.
(in millions, except per ton data)
Three months ended Sep. 30, 2025
| Met Segment Sales | Tons Sold | Coal Revenues | Realization/ton(1) | % of Met Tons Sold |
|---|---|---|---|---|
| Export - Other Pricing Mechanisms | 1.4 | $153.3 | $107.25 | 40% |
| Domestic | 0.9 | $130.1 | $151.63 | 24% |
| Export - Australian Indexed | 1.3 | $136.0 | $106.39 | 36% |
| Total Met Coal Revenues | 3.6 | $419.3 | $117.62 | 100% |
| Thermal Coal Revenues | 0.3 | $23.4 | $81.64 | |
| Total Met Segment Coal Revenues (excl. freight & handling)(1) | 3.9 | $442.8 | $114.94 |
__________________________________
1. Represents Non-GAAP coal sales realization which is defined and reconciled under “Non-GAAP Financial Measures” and “Results of Operations.”
Cost of Coal Sales
| (in millions, except per ton data) | Three months ended Sep. 30, 2025 | Three months ended June 30, 2025 |
|---|---|---|
| Met Segment | $461.6 | $480.0 |
| Met Segment (excl. freight & handling/idle)(1) | $374.7 | $388.8 |
| (per ton) | ||
|---|---|---|
| Met Segment(1) | $97.27 | $100.06 |
__________________________________
1. Represents Non-GAAP cost of coal sales and Non-GAAP cost of coal sales per ton which is defined and reconciled under “Non-GAAP Financial Measures” and “Results of Operations.”
Alpha’s Met segment cost of coal sales decreased to an average of $97.27 per ton in the third quarter, compared to $100.06 per ton in the second quarter.
Liquidity and Capital Resources
Cash provided by operating activities in the third quarter decreased to $50.6 million as compared to $53.2 million in the second quarter. Capital expenditures for the third quarter were $25.1 million compared to $34.6 million for the second quarter.
As of September 30, 2025, the company had total liquidity of $568.5 million, including cash and cash equivalents of $408.5 million, short-term investments of $49.4 million, and $185.5 million of unused availability under the asset-based revolving credit facility (ABL), partially offset by a minimum required liquidity of $75.0 million as required by the ABL. As of September 30, 2025, the company had no borrowings and $39.5 million in letters of credit outstanding under the ABL. Total long-term debt, including the current portion of long-term debt as of September 30, 2025, was $5.0 million.
Share Repurchase Program
As previously announced, Alpha’s board of directors authorized a share repurchase program allowing for the expenditure of up to $1.5 billion for the repurchase of the company’s common stock. As of October 31, 2025, the company had acquired approximately 6.8 million shares of common stock at a cost of approximately $1.1 billion since the start of the program. The number of common stock shares outstanding as of October 31, 2025 was 12,858,024, not including the potential effect of unvested equity awards.
The timing and amount of share repurchases will be based on various factors, including but not limited to market conditions, the trading price of the stock, applicable legal requirements, compliance with the provisions of the company’s debt agreements, and other factors.
2025 Guidance Adjustments and Performance Update
Alpha is lowering its 2025 guidance range for capital contributions to equity affiliates to between $35 million and $41 million, down from the prior range of $44 million to $54 million.
As of October 29, 2025, Alpha has committed and priced approximately 85% of its metallurgical coal for 2025 at an average price of $122.57 per ton and 100% of its thermal coal for the year at an average price of $80.27 per ton.
2025 Guidance
| In millions of tons | Low | High |
|---|---|---|
| Metallurgical | 13.8 | 14.8 |
| Thermal | 0.8 | 1.2 |
| Met Segment - Total Shipments | 14.6 | 16.0 |
| Committed/Priced123 | Committed | Average Price |
| Metallurgical - Domestic | $152.25 | |
| Metallurgical - Export | $110.84 | |
| Metallurgical Total | 85% | $122.57 |
| Thermal | 100% | $80.27 |
| Met Segment | 87% | $118.97 |
| Committed/Unpriced13 | Committed | |
| Metallurgical Total | 13% | |
| Thermal | --% | |
| Met Segment | 12% | |
| Costs per ton4 | Low | High |
| Met Segment | $101.00 | $107.00 |
| In millions (except taxes) | Low | High |
| SG&A5 | $48 | $54 |
| Idle Operations Expense | $21 | $29 |
| Net Cash Interest Income | $6 | $12 |
| DD&A | $165 | $185 |
| Capital Expenditures | $130 | $150 |
| Capital Contributions to Equity Affiliates6 | $35 | $41 |
| Cash Tax Rate | 0% | 5% |
Notes:
1. Based on committed and priced coal shipments as of October 29, 2025. Committed percentage based on the midpoint of shipment guidance range.
2. Actual average per-ton realizations on committed and priced tons recognized in future periods may vary based on actual freight expense in future periods relative to assumed freight expense embedded in projected average per-ton realizations.
3. Includes estimates of future coal shipments based upon contract terms and anticipated delivery schedules. Actual coal shipments may vary from these estimates.
4. Note: The Company is unable to present a quantitative reconciliation of its forward-looking non-GAAP cost of coal sales per ton sold financial measures to the most directly comparable GAAP measures without unreasonable efforts due to the inherent difficulty in forecasting and quantifying with reasonable accuracy significant items required for the reconciliation. The most directly comparable GAAP measure, GAAP cost of sales, is not accessible without unreasonable efforts on a forward-looking basis. The reconciling items include freight and handling costs, which are a component of GAAP cost of sales. Management is unable to predict without unreasonable efforts freight and handling costs due to uncertainty as to the end market and FOB point for uncommitted sales volumes and the final shipping point for export shipments. These amounts have varied historically and may continue to vary significantly from quarter to quarter and material changes to these items could have a significant effect on our future GAAP results.
5. Excludes expenses related to non-cash stock compensation and non-recurring expenses.
6. Includes contributions to fund normal operations at our DTA export facility and expected capital investments related to the facility upgrades.
Conference Call
The company plans to hold a conference call regarding its third quarter results on November 6, 2025, at 10:00 a.m. Eastern time. The conference call will be available live on the investor section of the company’s website at https://alphametresources.com/investors. Analysts who would like to participate in the conference call should dial 877-407-0832 (domestic toll-free) or 201-689-8433 (international) approximately 15 minutes prior to start time.
About Alpha Metallurgical Resources
Alpha Metallurgical Resources (NYSE: AMR) is a Tennessee-based mining company with operations across Virginia and West Virginia. With customers across the globe, high-quality reserves and significant port capacity, Alpha reliably supplies metallurgical products to the steel industry. For more information, visit www.AlphaMetResources.com.
Forward-Looking Statements
This news release includes forward-looking statements. These forward-looking statements are based on Alpha’s expectations and beliefs concerning future events and involve risks and uncertainties that may cause actual results to differ materially from current expectations. These factors are difficult to predict accurately and may be beyond Alpha’s control. Forward-looking statements in this news release or elsewhere speak only as of the date made. New uncertainties and risks arise from time to time, and it is impossible for Alpha to predict these events or how they may affect Alpha. Except as required by law, Alpha has no duty to, and does not intend to, update or revise the forward-looking statements in this news release or elsewhere after the date this release is issued. In light of these risks and uncertainties, investors should keep in mind that results, events or developments discussed in any forward-looking statement made in this news release may not occur. See Alpha’s filings with the U.S. Securities and Exchange Commission for more information.
FINANCIAL TABLES FOLLOW
Non-GAAP Financial Measures
The discussion below contains “non-GAAP financial measures.” These are financial measures that either exclude or include amounts that are not excluded or included in the most directly comparable measures calculated and presented in accordance with generally accepted accounting principles in the United States (“U.S. GAAP” or “GAAP”). Specifically, we make use of the non-GAAP financial measures “Adjusted EBITDA,” “non-GAAP coal revenues,” “non-GAAP cost of coal sales,” and “non-GAAP coal margin.” In addition to net income, we use Adjusted EBITDA to measure the operating performance of our reportable segment. Adjusted EBITDA does not purport to be an alternative to net income as a measure of operating performance or any other measure of operating results, financial performance, or liquidity presented in accordance with GAAP. Moreover, this measure is not calculated identically by all companies and therefore may not be comparable to similarly titled measures used by other companies. Adjusted EBITDA is presented because management believes it is a useful indicator of the financial performance of our coal operations. We use non-GAAP coal revenues to present coal revenues generated, excluding freight and handling fulfillment revenues. Non-GAAP coal sales realization per ton for our operations is calculated as non-GAAP coal revenues divided by tons sold. We use non-GAAP cost of coal sales to adjust cost of coal sales to remove freight and handling costs, depreciation, depletion and amortization – production (excluding the depreciation, depletion and amortization related to selling, general and administrative functions), accretion on asset retirement obligations, amortization of acquired intangibles, net, and idled and closed mine costs. Non-GAAP cost of coal sales per ton for our operations is calculated as non-GAAP cost of coal sales divided by tons sold. Non-GAAP coal margin per ton for our coal operations is calculated as non-GAAP coal sales realization per ton for our coal operations less non-GAAP cost of coal sales per ton for our coal operations. The presentation of these measures should not be considered in isolation, or as a substitute for analysis of our results as reported under GAAP.
Management uses non-GAAP financial measures to supplement GAAP results to provide a more complete understanding of the factors and trends affecting the business than GAAP results alone. The definition of these non-GAAP measures may be changed periodically by management to adjust for significant items important to an understanding of operating trends and to adjust for items that may not reflect the trend of future results by excluding transactions that are not indicative of our core operating performance. Furthermore, analogous measures are used by industry analysts to evaluate the Company’s operating performance. Because not all companies use identical calculations, the presentations of these measures may not be comparable to other similarly titled measures of other companies and can differ significantly from company to company depending on long-term strategic decisions regarding capital structure, the tax jurisdictions in which companies operate, capital investments and other factors.
Included below are reconciliations of non-GAAP financial measures to GAAP financial measures.
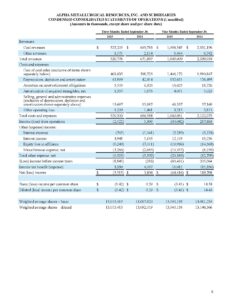
ALPHA METALLURGICAL RESOURCES, INC. AND SUBSIDIARIES
CONDENSED CONSOLIDATED STATEMENTS OF OPERATIONS (Unaudited)
(Amounts in thousands, except share and per share data)
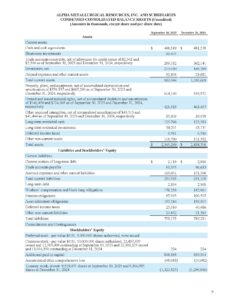
ALPHA METALLURGICAL RESOURCES, INC. AND SUBSIDIARIES
CONDENSED CONSOLIDATED BALANCE SHEETS (Unaudited)
(Amounts in thousands, except share and per share data)
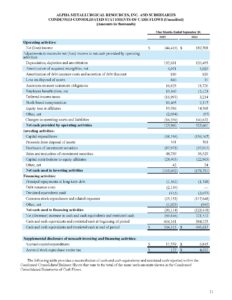
ALPHA METALLURGICAL RESOURCES, INC. AND SUBSIDIARIES
CONDENSED CONSOLIDATED STATEMENTS OF CASH FLOWS (Unaudited)
(Amounts in thousands)
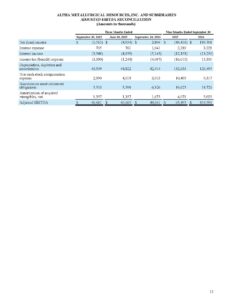
ALPHA METALLURGICAL RESOURCES, INC. AND SUBSIDIARIES
ADJUSTED EBITDA RECONCILIATION
(Amounts in thousands)
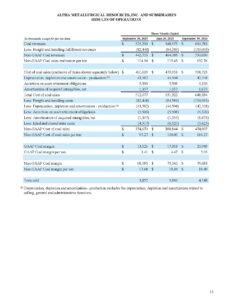
ALPHA METALLURGICAL RESOURCES, INC. AND SUBSIDIARIES
RESULTS OF OPERATIONS
Media Contact
Investor Contact
InvestorRelations@
External Resources
Metallurgical Coal Producers Association (MCPA)
![]()
National Mining Association (NMA) Industry News and Resources
![]()